

How to Read Bitcoin Charts for Beginners
In 2023, the crypto landscape has been nothing short of explosive, with Bitcoin leading the charge. Understanding how to read Bitcoin charts can empower you to make informed decisions in this volatile market. With the global crypto market cap surpassing $1 trillion, the importance of chart analysis has never been higher.
So, how can one navigate these complex charts? In this article, we delve into the essentials of Bitcoin chart reading, using real-world data and examples to demystify this skill. By the end of this guide, you should feel equipped to interpret Bitcoin’s price movements and trends like a pro.
Understanding the Basics of Bitcoin Charts
Before diving into the nitty-gritty, it’s vital to grasp the basic components of Bitcoin charts:
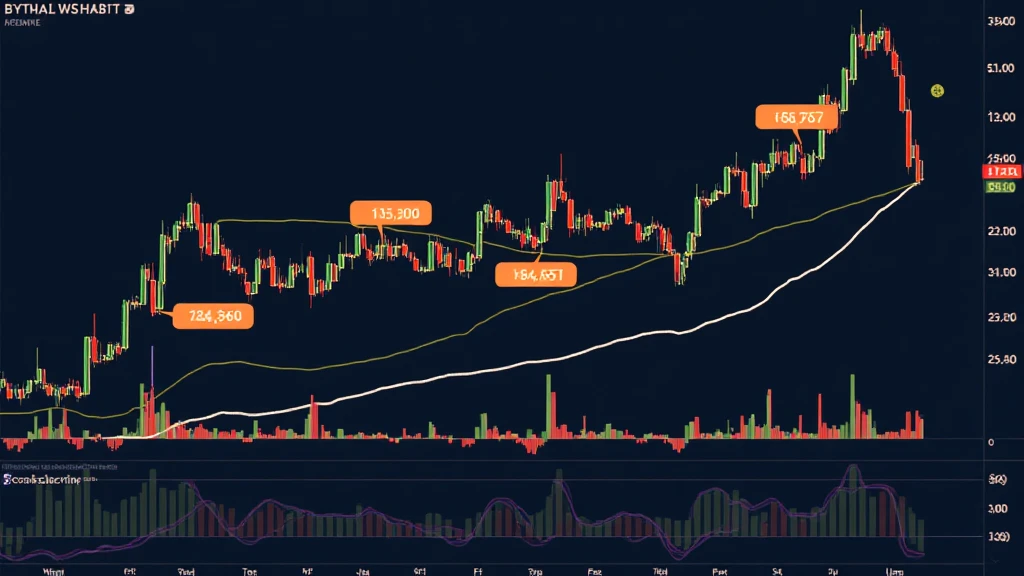
- Price: The vertical axis generally represents Bitcoin’s price, while the horizontal axis shows time.
- Volume: Often shown as a histogram below the price chart, it represents the number of coins traded.
- Time Frames: Common time frames include 1 hour, 4 hours, daily, and weekly charts.
These components form the foundation for more complex analyses.
Candlestick Charts: The Key to Understanding Market Sentiment
Candlestick charts are one of the most popular ways to visualize Bitcoin prices. Each candlestick shows four key data points: Open, High, Low, and Close (OHLC). Here’s how to interpret them:
- Green Candles: Indicate that the price closed higher than it opened, suggesting bullish sentiment.
- Red Candles: Show that the price closed lower than it opened, indicating bearish sentiment.
- Wicks: The vertical lines of the candlestick represent the highest and lowest prices during the time interval.
Understanding these elements allows traders to assess current market conditions effectively.
Technical Indicators: Tools for Analysis
Once you’re comfortable with the basic chart components, you can enhance your analysis using technical indicators:
- Moving Averages: Helps smooth out price data and identify trends over a specific period.
- Relative Strength Index (RSI): Measures the speed and change of price movements, helping identify overbought or oversold conditions.
- Bollinger Bands: These indicate price volatility and help identify potential entry and exit points.
For example, if Bitcoin is trading at $60,000, an RSI above 70 might suggest that it’s overbought, signaling a potential price correction.
Analyzing Market Trends and Patterns
Recognizing patterns on Bitcoin charts can significantly improve your trading strategy. Here are some key patterns to look out for:
- Head and Shoulders: Indicates a reversal pattern, signaling a trend change.
- Double Tops and Bottoms: Highlight potential reversal points.
- Triangles: These can signal continuation patterns or reversals, depending on whether they’re ascending or descending.
By incorporating these patterns into your analysis, you can better predict future price movements effectively.
Real-World Example: Analyzing Bitcoin’s Price Action
Let’s analyze Bitcoin’s price action over the last few months. From the data collected, we can observe key events:
| Date | Price Open | Price Close | Volume |
|---|---|---|---|
| 2023-01-01 | $45,000 | $48,000 | 2.5M BTC |
| 2023-02-01 | $48,000 | $52,000 | 3.0M BTC |
| 2023-03-01 | $52,000 | $50,000 | 2.8M BTC |
In this table, we see a price increase followed by a slight correction. Recognizing such patterns can assist you in making informed tactical decisions.
Applying Your Knowledge in the Vietnamese Market
As the Vietnamese cryptocurrency market continues to expand, it’s essential to incorporate local data when analyzing Bitcoin charts. In Vietnam, significant growth was witnessed, with over 30% year-on-year increase in cryptocurrency adoption rates. Understanding local trading behaviors can provide insights into chart analysis. Using the Vietnamese term tiêu chuẩn an ninh blockchain can also guide how to navigate this market’s complexities.
With increased user engagement, the demand for comprehensive tools for reading Bitcoin charts is becoming essential for both seasoned and new traders alike.
Conclusion: Mastering Chart Reading Skills
Reading Bitcoin charts is an essential skill that can give traders an edge in the fast-paced cryptocurrency market. By understanding charts, candlestick patterns, technical indicators, and market trends, you can make informed trading decisions. As the Bitcoin market continues to evolve, staying updated with new methods and data is crucial.
As you continue your journey in cryptocurrency trading, remember to regularly analyze Bitcoin charts, utilize technical tools, and keep an eye on local market behavior. Inspire your trading strategy today by mastering the art of chart reading.
For more expert insights, visit hibt.com. Here at cryptobestnews, we strive to keep you informed and ahead in the crypto world.
Expert Author: Dr. Alex Nguyen
A leading blockchain analyst with over 20 published papers in the field and significant contributions to various major cryptocurrency audits.

