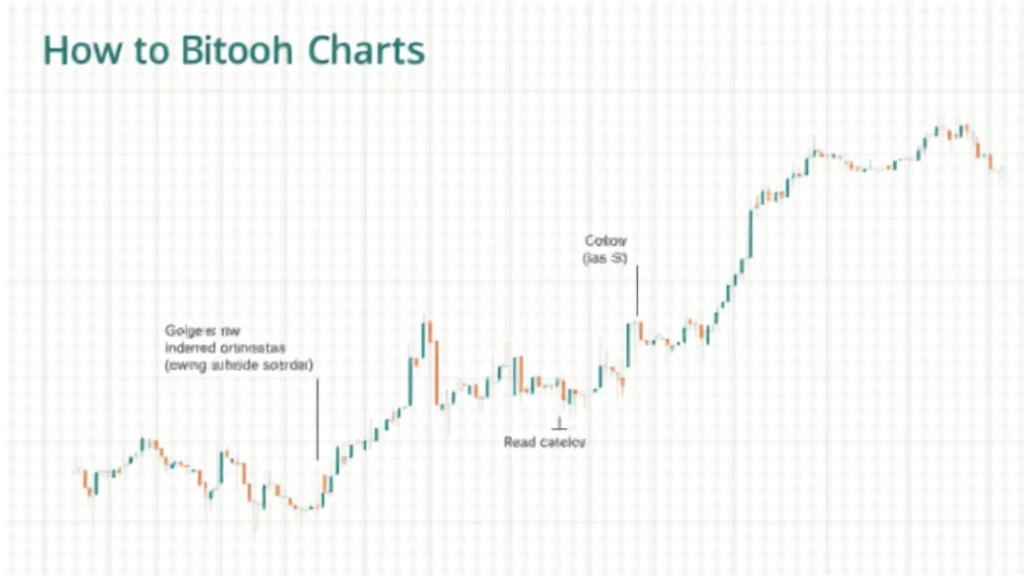
How to Read Bitcoin Charts: Unlocking Market Trends
Understanding how to read Bitcoin charts is essential for anyone diving into the world of cryptocurrency trading. As of 2024, over 250 million people globally are engaged in crypto markets, with Vietnam showing impressive user growth rates, reaching 35% annually. With $4.1B lost to DeFi hacks in 2024, it is crucial to equip yourself with knowledge that not only aids in making profitable trades but also protects your investments. The ability to interpret these charts can help you navigate this volatile world with confidence and savvy.
Understanding the Basics of Bitcoin Charts
Before diving into technical analysis, let’s ensure we’re on the same page about what a Bitcoin chart represents. Simply put, a Bitcoin chart displays price movements of Bitcoin over a specific timeframe. You will commonly see candlestick charts or line charts.
- Candlestick Charts: These are the most popular among traders. Each candlestick reflects the opening, closing, highest, and lowest prices for Bitcoin within a predetermined time period.
- Line Charts: These are simpler and show the price movement of Bitcoin continuously over time, which can help to visualize trends more easily.
The Importance of Timeframes
When reading Bitcoin charts, choosing the right timeframe is vital. Different timeframes can provide different insights:

- Short-term (1 minute to 1 hour): Ideal for day traders who are capitalizing on small price movements.
- Medium-term (daily to weekly): Useful for swing traders looking to capture price swings.
- Long-term (monthly to yearly): Best for investors who focus on the broader trends and fundamentals of the Bitcoin market.
For instance, a recent analysis showed that Bitcoin experienced a 52% price increase over a few months in late 2023, making it crucial to analyze charts over longer periods for a comprehensive view.
Critical Indicators to Observe
Several indicators can help you gain deeper insights into Bitcoin’s market dynamics. Let’s break down a few:
- Moving Averages (MA): These smooth out price data to show the trend direction over a specific period. The 50-day MA and 200-day MA are particularly popular in Bitcoin analysis.
- Relative Strength Index (RSI): This momentum oscillator measures the speed and change of price movements. An RSI above 70 suggests Bitcoin may be overbought, while below 30 indicates it may be oversold.
- Bollinger Bands: These indicate market volatility. When the bands tighten, it suggests a period of low volatility and potential price movement.
As per a 2023 report by CoinMarketCap, Bitcoin’s volatility was recorded at 80%, significantly impacted by external market factors.
Understanding Price Patterns
Price patterns can offer predictions toward future movements. Let’s examine a couple of essential patterns:
- Head and Shoulders: This pattern typically signals a market reversal. If you see this on your Bitcoin chart, it could indicate a downward trend coming.
- Double Bottoms and Tops: These are also key reversal indicators. A double bottom indicates a potential bullish trend, while a double top suggests a bearish trend.
For example, in early 2024, Bitcoin formed a double bottom pattern, leading to a price surge of over 25% within several weeks.
Utilizing Charting Tools
To bring your analysis to the next level, using charting tools and platforms is recommended. Websites like HIBT provide user-friendly interfaces that can help you access advanced charting features. Additionally, many of these tools support essential functionalities, such as:
- Customizable layout options
- Integration with indicators
- Real-time updates on market movements
Moreover, these platforms often come with educational resources to assist users in learning how to read Bitcoin charts effectively.
Key Takeaways for Bitcoin Trading
Mastering the art of reading Bitcoin charts takes time and patience. However, here are a few key takeaways to help you get started:
- Always consider multiple timeframes to get a comprehensive view of market trends.
- Analyze various indicators but focus on those that align with your trading strategy.
- Be aware of market sentiments and news, as they can have an immediate impact on chart patterns.
For example, regulatory news regarding blockchain security standards, especially in countries like Vietnam where the crypto market is rapidly evolving, can significantly influence Bitcoin prices.
In conclusion, understanding how to read Bitcoin charts is essential for any trader looking to navigate the complexities of the cryptocurrency market. By leveraging the tools and insights mentioned above, you can better position yourself to interpret market trends and make informed trading decisions.
Conclusion
If you want to dive deeper into trading and investment strategies related to Bitcoin, consider exploring more resources like those available on platforms such as HIBT. As always, remember that investing in cryptocurrencies comes with risks, and it’s recommended to consult with investment advisors and local authorities for tailored advice.
Work towards mastering how to read Bitcoin charts, and you’ll unlock the potential to make data-driven decisions in the fast-paced world of cryptocurrency trading.


