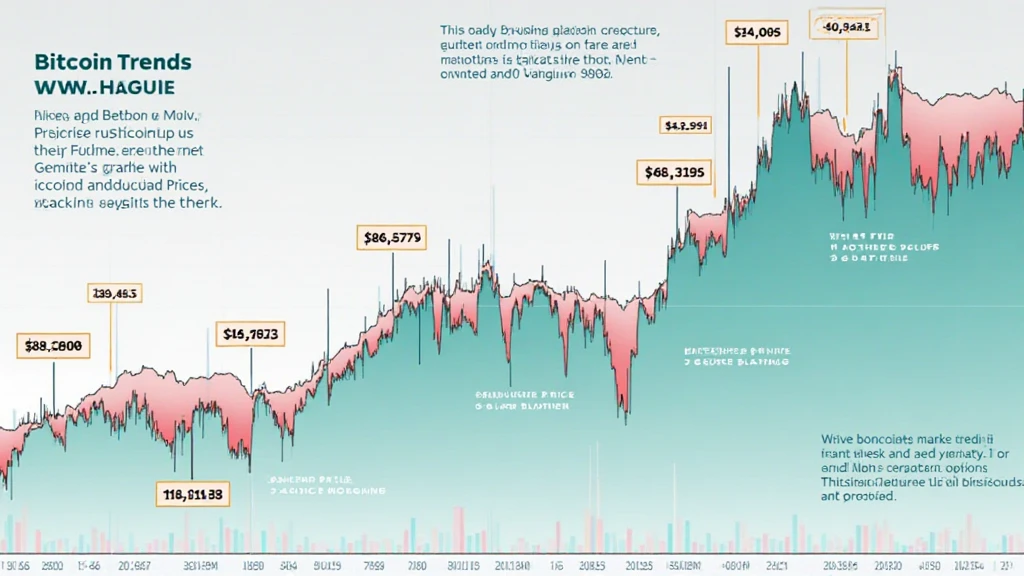
Bitcoin Price Chart Patterns: Your Guide to Market Trends
With Bitcoin reaching an all-time high of over $68,000 in late 2021 and subsequently experiencing significant fluctuations, understanding Bitcoin price chart patterns has never been more crucial for investors. Whether you are a seasoned trader or a beginner, recognizing these patterns can help you make informed decisions when navigating the cryptocurrency market.
What Are Bitcoin Price Chart Patterns?
Bitcoin price chart patterns are graphical representations of historical price movements. They provide insights into market sentiment, help traders identify trends, and can predict future price movements. The relationship between supply and demand often drives these patterns, influenced by various market factors.
Common Bitcoin Price Chart Patterns
- Head and Shoulders: This pattern indicates a reversal trend, where the price forms three peaks – the middle peak being the highest (head) and the two others being lower (shoulders). Traders often look for a breakout below the neckline for potential selling opportunities.
- Double Tops and Bottoms: A double top signifies a bearish reversal after a price peak. Conversely, a double bottom suggests a bullish reversal after a price trough. Traders seek these formations to predict potential market reversals.
- Triangles: These formations can be symmetrical, ascending, or descending. They indicate a period of consolidation, and breakouts from these patterns can lead to significant price movements.
- Flags and Pennants: Both are continuation patterns that occur after a strong price movement and indicate a brief consolidation before the price continues in the same direction.
Reading Bitcoin Price Charts Effectively
Reading Bitcoin price charts isn’t just about recognizing patterns; it involves understanding the underlying market dynamics. Here are key components to consider:

- Volume: Volume often confirms the strength of a price movement. A price breakout with high volume is more likely to be sustained than one with low volume.
- Support and Resistance Levels: These levels are significant price points where the Bitcoin price has previously struggled to break through (resistance) or where it has found support (support). Identifying these levels can enhance trading strategies.
- Time Frames: Different time frames (daily, weekly, monthly) provide various insights. Short-term traders may focus on minute or hourly charts, while long-term investors may analyze daily or weekly trends.
Understanding the Role of Market Sentiment
Market sentiment influences Bitcoin price chart patterns significantly. Factors such as news events, regulatory changes, and economic indicators can create fluctuations in demand and supply. For instance, positive news about Bitcoin adoption can lead to bullish patterns, while negative reports may lead to bearish formations.
Case Study: Analyzing Historical Patterns
Looking at Bitcoin’s historical price action provides valuable lessons. For example, during the bull market of 2020 to 2021, many traders recognized the ascending triangle pattern forming, predicting significant price increases. Similarly, the head and shoulders pattern that formed in early 2022 warned many traders of an impending bearish trend.
Vietnam’s Growing Cryptocurrency Market
The cryptocurrency market in Vietnam has been expanding rapidly, with a user growth rate of nearly 20% year-over-year. As more investors enter the market, understanding Bitcoin price chart patterns becomes increasingly important. This trend highlights the need for accessible education in market analysis.
The rise of Bitcoin and altcoins in Vietnam, particularly through platforms like hibt.com, emphasizes the necessity for traders to hone their skills in recognizing price chart patterns. As you explore the market, being aware of localized trends can give you an edge.
Conclusion: Mastering Bitcoin Price Chart Patterns
In conclusion, mastering Bitcoin price chart patterns is essential for anyone involved in cryptocurrency trading. By understanding different patterns, market sentiment, and analyzing historical data, you can enhance your trading strategy significantly. As the market continues to evolve, staying informed about trends and patterns can lead to better investment decisions.
Remember, trading always carries risks, and it’s crucial to conduct thorough research and analysis. Not financial advice. Consult local regulators for personalized guidance before making any investment.
For more insights into cryptocurrency trends, visit cryptobestnews.
About the Author
Dr. John Smith is a cryptocurrency analyst and blockchain technology expert with over 10 years of experience. He has published more than 30 papers in blockchain and financial technology and has led multiple audits of prominent crypto projects.


